Marblehead School Committee
Communications Subcommittee Newsletter
Community Newsletter | April
Summary
FY27 School Budget & Override Update
The School Committee has approved a $47.6 million FY27 (Fiscal Year 27) budget that required eliminating 18.25 FTEs (Full-Time Equivalent), representing 22 positions, to close a $3.1 million gap. Reaching a balanced budget took two rounds of cuts, structural fund shifts, and a one-time financial maneuver that depleted one of the district's last financial safety nets, and cannot be repeated. FY28 will be harder: a large special education tuition bill returns to the budget as a real cost, and contractual teacher salary increases take effect. Together, those obligations create a structural gap larger than what the district just closed, with no reserves left to cushion it.
To address this, the School Committee and Select Board have jointly developed a three-tier Proposition 2½ override framework for residents to consider. If approved at Town Meeting on May 4, the override options will appear on the June 9 ballot. This newsletter explains the budget, how we got here, what the override tiers include, and what the vote will look like. We encourage every resident to read it, share it, and come to Town Meeting and the June elections informed.
We've provided some jump links to the different sections of this newsletter, if you're eager to read about a specific topic.
- FY27 School Budget
- Enrollment, Staffing, and District Efficiency
- Override Options
- Next Steps
- Learn More
Public Information Sessions
The School Committee Communications Subcommittee is planning public information sessions ahead of Town Meeting and the June election to help explain the budget and the override options. We've scheduled two "open office hours" with representatives from the Town and School Committee at Dunkin' on Pleasant street on Wednesday, April 29th, from 3-4pm, and Thursday, April 30th, from 9-11am. We are planning on hosting additional forums as we get closer to the June election, and we will publicize those as they are scheduled.
Budget
FY27 School Budget Approved
On April 9, the School Committee voted unanimously to approve a $47.6 million operating budget for fiscal year 2027. This is the budget we will bring to Annual Town Meeting on May 4 for final approval by residents. Reaching that number required $3.1 million in total reductions from the cost of maintaining current services.
|
|
|
For the last two decades, the schools have endured silent cuts, where the dollar amount increased by a small percentage, but didn't keep up with the 5-6% increase in fixed costs. This marks the first time in recent memory that the total dollar amount for the school budget has been reduced.
How the Budget Developed
The district's level-services cost was approximately $50.7 million. Level-services is what it would take to maintain current programs and keep staff unchanged.
Round 1 (January through March): To reach level-funding (where the district receives the same funds as last year), the district identified ~$1.7 million in reductions, eliminating 14.75 FTE (Full-Time Equivalent) positions including five teachers and one maintenance worker.
Round 2 (March through April): The town asked schools to absorb an additional $1.5 million, bringing total position eliminations to 18.25 FTEs, representing 22 positions. A last-minute collaborative tuition increase, averaging 9.4%, with the highest-tier programs rising 12%, required deeper cuts than initially planned.
Why the Approved Budget is More Fragile Than it Looks
Right-sizing savings: Some reductions reflect genuine efficiencies and demographic adjustments. The consolidation of Bell, Coffin, and Gerry into Brown Elementary is the clearest example. Enrollment has declined 24% since 2016, and the district has reduced staffing by 14.7% over the same period. These are real, lasting savings.
Structural fund shifts: A number of positions have been moved out of the General Fund and onto grant or revolving accounts. This makes the operating budget appear smaller, but those costs remain in the district. Some will need to be moved back in future years as grant funding changes.
A one-time financial maneuver that cannot be repeated: To close the final gap, the district will prepay $1.5 million in special education out-of-district (OOD) tuition using years of accumulated surplus funds. This reduces the tuition line from $5.3 million to $3.8 million for FY27 only. Assistant Superintendent Pfifferling was direct about what this means: this eliminates one of the district's three financial safety nets. There are no more reserves of this type available. This approach is not an option in FY28.
What FY28 Looks Like From Here
The removal of these safety nets, combined with two cost obligations already locked in, means the path to a balanced FY28 budget is significantly harder than what the district just navigated.
Special education out-of-district tuition: The $1.5 million prepaid from surplus will need to appear again in the FY28 budget as a real line item. Out-of-district tuition grew 12.64% for FY27. The district cannot reduce these costs without affecting students who have legally protected IEP (Individualized Education Program) rights.
Contractual salary obligations: The district's collective bargaining agreement with teachers, ratified last year, includes contractual salary increases taking effect in FY28 and FY29. These are legal obligations. The Finance Committee's analysis projects that school department spending, excluding shared benefits, will increase roughly 9% in FY28, with the largest driver being the combination of restored special education tuition and contract implementation.
|
The bottom line on FY28: Without additional revenue through a Prop. 2½ override, the district will face a structural gap in FY28 that is larger than what it just closed in FY27, and it will have no remaining one-time reserves to draw on. The cuts required to balance FY28 without new revenue would need to come directly from programs and staff. |
Key Cost Drivers: FY27 Growth Rates
Annual cost growth vs. revenue cap
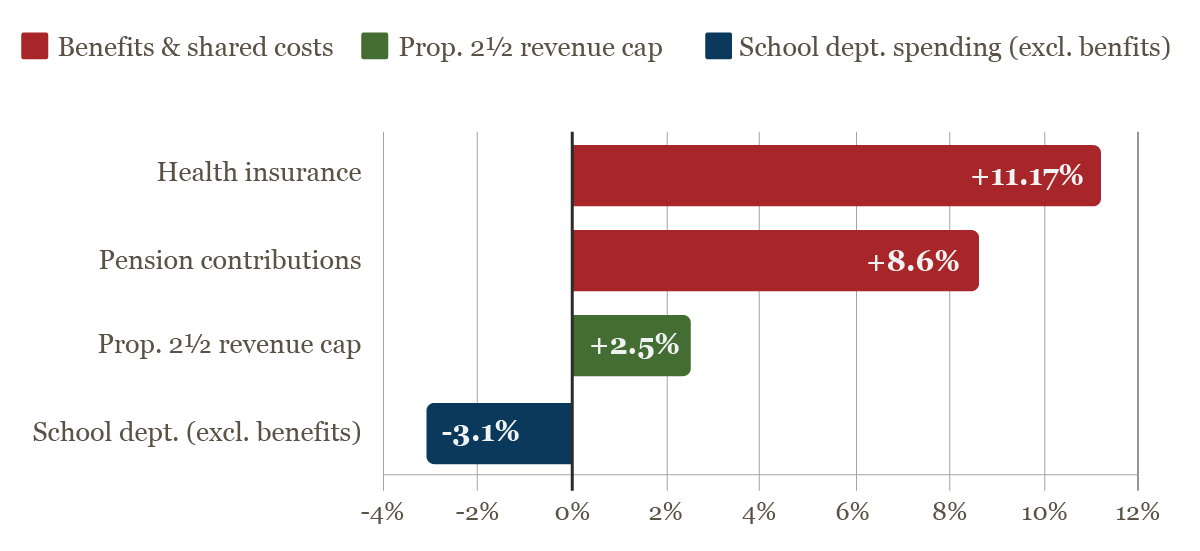
Source: Finance Committee analysis, April 2026. Health insurance: Massachusetts Group Insurance Commission FY27 rates.
District Success in the Face of Challenges
It's worth stepping back for a moment. These reductions are real and they are significant. But, they do not reflect a district that has been poorly managed. They reflect a district that has been well-run under structural pressure that no amount of careful budgeting can permanently absorb. Superintendent Robidoux and Assistant Superintendent Pfifferling review expenditures monthly with the full School Committee in open public meetings, and the financial discipline they have brought to this process has been exceptional. Meanwhile, the academic outcomes speak for themselves: Marblehead students outperform the state average on MCAS (Massachusetts Comprehensive Assessment System) by 15 percentage points, Marblehead High School ranks in the top 20% of Massachusetts public high schools with a 99% graduation rate, and our AP course participation rate of 67% is nearly double the national average. All while spending at or below the state per-pupil average. This is a high-performing district that has done more with less for years. The decisions ahead are about what comes next.
Learn More
Our full district budget is available here. This includes the specific changes we've made to meet our $3.1M reduction, which can be found at the bottom of each school's section under Additions/Reductions.
You can also review recordings of our School Committee meetings, including Budget Subcommittee meetings and our regular budget expenditure reviews, on our YouTube page.
District Trends
Enrollment, Staffing, and District Efficiency
A common question in the community is: if enrollment is down, why haven't costs decreased in the same proportion? The data below, drawn from DESE (Massachusetts Department of Elementary and Secondary Education) annual reports and district financial records, provides context.
Enrollment Trends
|
|
|
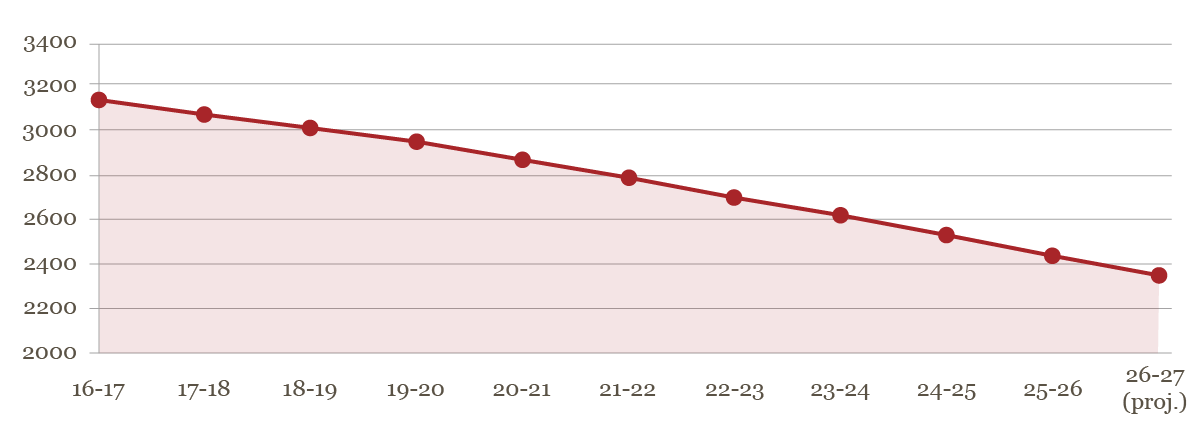
Enrollment has declined roughly 3.88% per year since 2019, driven largely by Marblehead's aging population. Residents age 65 and older have grown from 17.9% to 22.6% of the town's population since 2016. This is roughly 1,100 more senior residents than a decade ago. Public school participation among school-aged children has remained steady at 76% to 79%.
Why Costs Do Not Fall Proportionally
| Factor | Why it limits proportional cuts |
| Operational floor | Every building requires nurses, custodians, and a principal regardless of whether a classroom has 18 students or 27. Fewer students rarely eliminate whole classes or teacher positions. |
| Special Education growth | Out-of-district special education tuition grew 12.64% for FY27, on top of double-digit increases in prior years. These costs are legally mandated and cannot be reduced without affecting students' IEP rights. |
| Contractual salaries | Salaries represent approximately 80% of the school budget. Cost-of-Living Adjustment (COLA) and step increases apply to all eligible employees every year under collective bargaining agreements. |
| Benefits cost growth | Health insurance rose 11.17% this cycle and pension contributions rose 8.6%. These shared costs are beyond the district's control. |
What Has Already Been Done
The district has taken significant structural steps in response to enrollment decline. The consolidation of Bell, Coffin, and Gerry Schools into Brown Elementary was a major, multi-year restructuring that reduced building overhead, eliminated redundant programs, and aligned the district's physical footprint with current enrollment.
How Marblehead Compares to the State Average
Despite the budget pressure, Marblehead continues to deliver strong academic outcomes while spending at or below the state average. The comparison below uses Massachusetts DESE data and U.S. News Best High Schools 2025 rankings.
Marblehead vs. Massachusetts State Average in Key Metrics
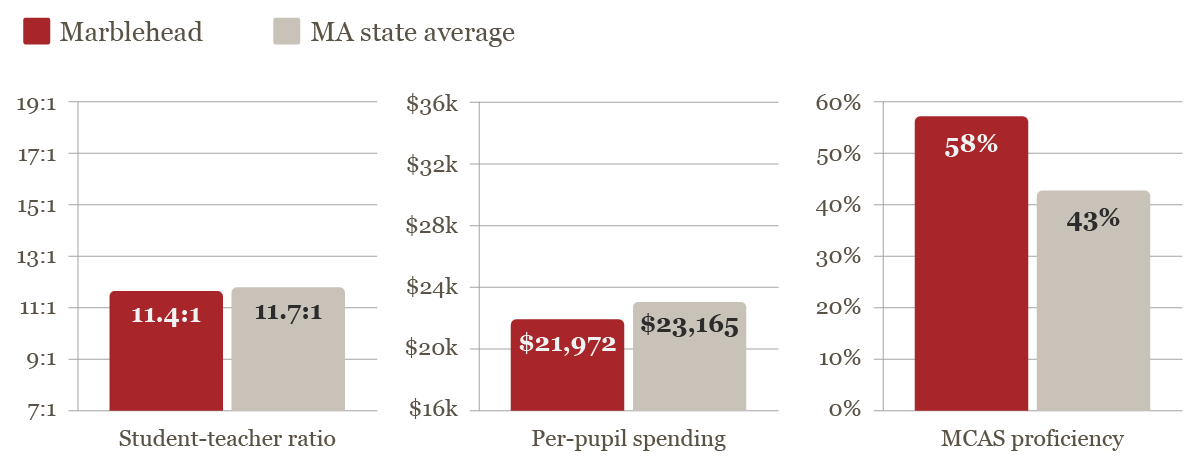
Marblehead High School ranks in the top 20% of Massachusetts public high schools (U.S. News and Report, 2025), carries a 99% graduation rate, and has a 67% AP course participation rate, nearly double the national average of 33%.
MCAS data: DESE Spring 2025. Per-pupil spending: MPS FY2024 DESE submission. Student-teacher ratio: DESE. MHS ranking: U.S. News Best High Schools 2025, 2023-24 school year. AP participation: College Board via U.S. News.
How We Spend Our Money vs. Comparable Districts
| District | Admin Spend (per pupil) |
Instructional Focus % |
Avg. Teacher Salary |
Total Per-Pupil | MCAS (Meeting/ Exceeding) |
|---|---|---|---|---|---|
| Marblehead | $744 | 64.2% | $86,428 | $21,972 | 58% |
| Swampscott | $882 | 61.8% | $89,150 | $22,410 | 52% |
| Hamilton-Wenham | $1,012 | 63.5% | $93,800 | $23,085 | 61% |
| Manchester-Essex | $1,154 | 65.1% | $94,450 | $24,150 | 66% |
| Bedford | $1,102 | 64.8% | $102,120 | $25,120 | 64% |
| Natick | $895 | 62.4% | $97,400 | $22,890 | 56% |
| State Average | $1,120 | 59.2% | $92,307 | $23,165 | 43% |
|
Admin Spend (per pupil): Total administrative expenditures divided by enrollment. Lower values indicate a greater share of spending directed toward classrooms. |
Instructional Focus %: Share of total expenditures directed toward instruction. The state average is 59.2%; Marblehead's 64.2% reflects a consistent prioritization of classroom spending. |
|
Avg. Teacher Salary: District average teacher salary. Context matters: salary levels reflect cost of living, contract history, and staff tenure mix. |
Total Per-Pupil: How much each district in the cohort spend per student. Marblehead spends less per-student, while staying competitive on MCAS testing, and significantly higher than the state average. |
Marblehead’s administrative spend of $744 per pupil is one of the lowest in the state for a district of its size. For context, the state average is $1,120. This means Marblehead is spending roughly 33% less on central office overhead (Superintendents, HR, and Legal) than the average Massachusetts district.
"Instructional Focus" measures the percentage of the budget that goes directly into the classroom (teachers, paraprofessionals, and instructional materials). At 64.2%, Marblehead ranks higher than the state average (59.2%) and many of its peers. This indicates that the district prioritizes the classroom even while operating under tight fiscal constraints.
Despite spending $1,193 less per pupil than the state average, Marblehead students outperform the state average by 15 percentage points on the MCAS. This Performance-to-Spending ratio is a primary indicator of a high-efficiency district.
Override Options
Three-Tier Override Framework
The School Committee voted 4-0 on April 9 to endorse a three-tier Proposition 2½ override framework, developed jointly with the Select Board. The Select Board approved the three-tier override on April 15. The three tiers are cumulative. Each tier includes everything in the tiers below it. No additional school-side override funding is proposed for FY27. Override revenue would begin in FY28. Marblehead has not passed a general operational override since 2005.
This chart shows the combined totals proposed for the town and the schools at the top, with a breakdown of the schools' portion of the funds below.
|
|
|
School-side override draw by fiscal year
(cumulative per tier)
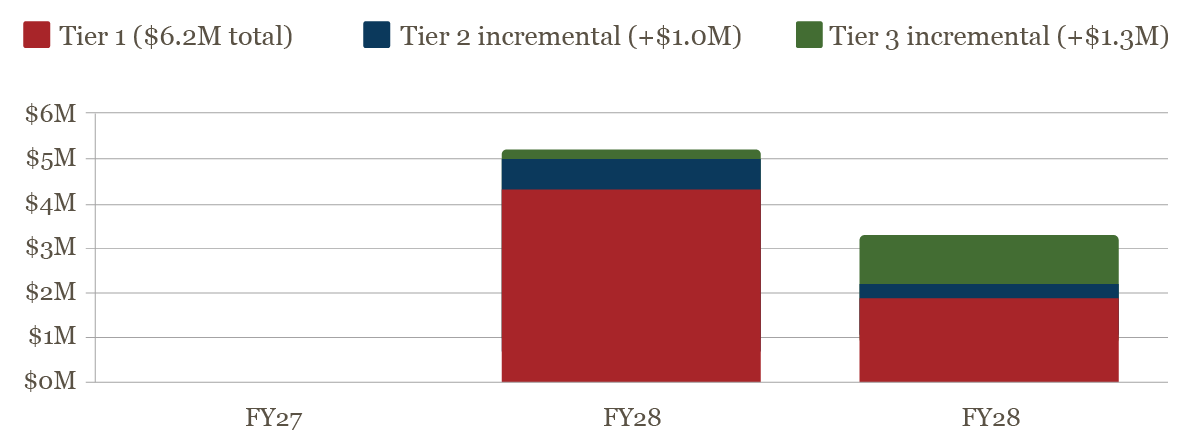
| Year | Tier 1 | Tier 2 | Tier 3 |
| FY27 | $0 | $0 | $0 |
| FY28 | $4.3M | $4.98M | $5.2M |
| FY29 | $1.9M | $2.2M | $3.3M |
| 3-Year Total | $6.2M | $7.2M | $8.5M |
What is Not Included in Any Tier
The School Department is not recommending the restoration of the 18.25 eliminated FTE positions in any tier, citing declining district enrollment. Of those positions, 8.95 are currently vacant and 9.3 are filled.
How the Vote Will Work
The Select Board and the School Committee have worked together to create a single override question to provide funding to both the town and the schools. We've proposed that the three tiers appear as subsections within a single ballot question, rather than as three separate questions. The exact ballot format is still pending, and will be determined if an override ballot question is approved at Town Meeting. More details will be shared as they are finalized.
Under the proposed structure, the result would be determined by the following rule: the highest-numbered tier receiving more than 50% of the vote takes effect. This means that if Tier 3 receives 52% approval and Tier 1 receives 64% approval, Tier 3 is the outcome, because it is the highest tier that crossed the majority threshold, regardless of the fact that a greater percentage voted for Tier 1. Voters can choose to vote for as many funding tiers as they like, including all three tiers, or no tiers at all. If no tier receives majority support, no override takes effect, and town departments work with the balanced budgets approved at Town Meeting.
|
Example: Tier 1 gets 64% | Tier 2 gets 55% | Tier 3 gets 52%: Tier 3 takes effect, because all three passed the 50% threshold and Tier 3 is the highest. The exact ballot language and structure will be published once the Select Board finalizes the override proposition, if it's approved at Town Meeting. |
Example Ballot Result (Illustrative Only)
|
|
|
Next Steps
Key Dates for Marblehead Residents
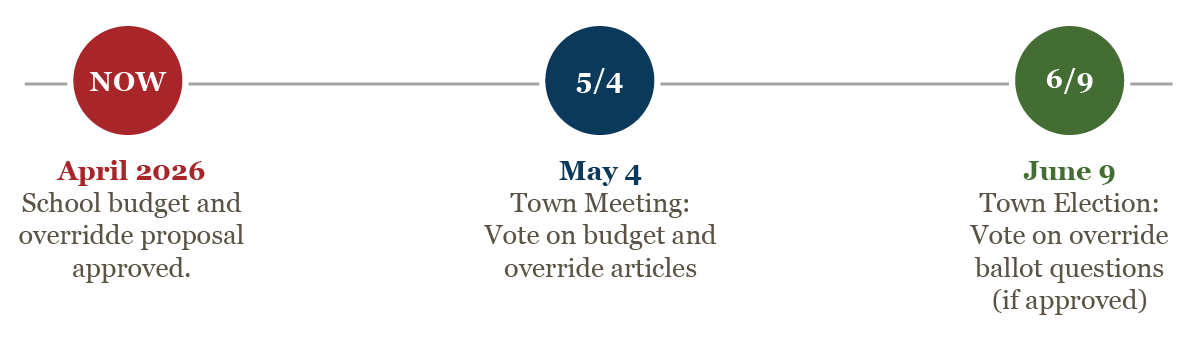
Town Meeting: Monday, May 4, 2026
Annual Town Meeting begins at 7:00 PM on Monday, May 4 at the MHS Field House. Residents will vote to approve the FY27 operating budget and, if supported, to authorize override questions for the June ballot. Town Meeting must authorize those articles before they can appear on the June ballot.
|
Free Childcare at Town Meeting: Marblehead Parks and Recreation is offering free babysitting for K-6 children of residents attending Town Meeting. Pre-registration is required. Learn more and register here. |
Town Election: Tuesday, June 9, 2026
If Town Meeting approves override articles, Marblehead residents will vote on the override ballot questions in the town election on June 9.
Learn More
Stay Informed
We are working to improve subscriptions to this newsletter, particularly with people who may not have a direct connection to the schools. Please forward this to anyone who might be interested, and encourage them to SUBSCRIBE to future updates.
Quick Links
-
School Committee YouTube Channel (meeting recordings)
-
School Committee Homepage (agendas, materials, policies, and more)
-
Marblehead Town Calendar (upcoming meetings)
-
Contact Us: schoolcommittee@marbleheadschools.org
Have questions or ideas for this newsletter?
Email gwazda.henry@marbleheadschools.org or clucas.melissa@marbleheadschools.org, or share your thoughts in public comment at one of our open meetings.
|
Marblehead Public Schools - School Committee 9 Widger Road · Marblehead, MA 01945 |
This newsletter is an informational communication from the Marblehead School Committee, produced and distributed using public resources. It is intended to inform residents about official actions and upcoming civic proceedings. Consistent with Massachusetts General Laws regarding the use of public funds, this communication does not advocate for or against any ballot question. All data is sourced from the approved school department budget documents (April 6, 2026), Massachusetts DESE, Finance Committee analysis (April 2026), and U.S. News Best High Schools data (2025).